
As a digital marketer AB Test are fun. Thinking of innovative UX designs are our daily bread and butter. If only there weren’t the math behind AB Testing. Well, we are visual people so check out the easy way to explain it graphically.
Let’s dive into the math behind AB Testing or better let’s visually describe how to interpret the bell curve. You might have seen the bell curve on several occasion when reading about AB Testing but not quite understood it. I remember my early struggles 😅
Imagine you have a default checkout design for your e-commerce store and every day you check the Conversion Rate and mark it with a dot. When you do this for a month the dots stack up. Believe it or not, you will end up with something similar as shown below — the bell curve!
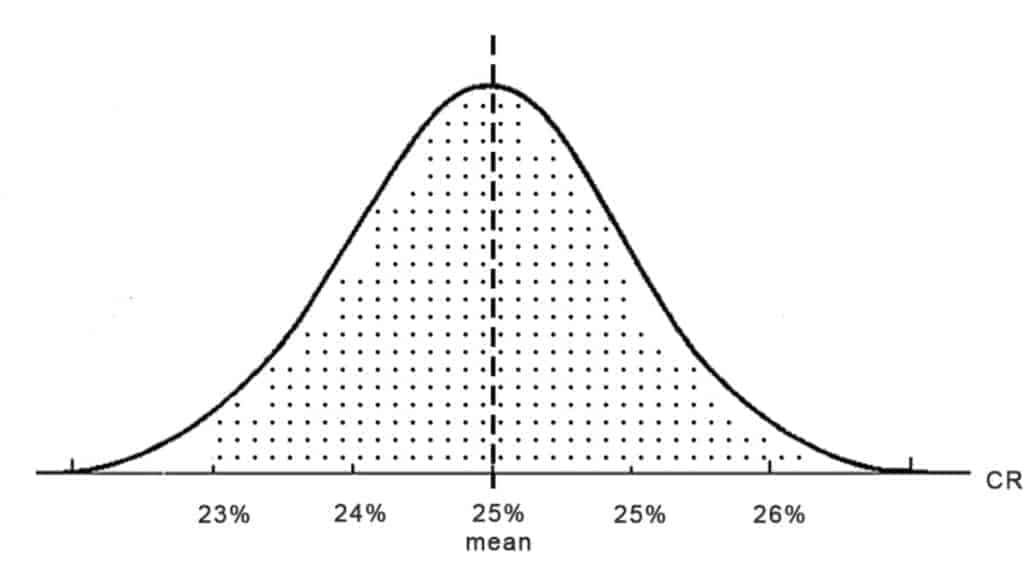
This distribution of dots shows that most days your CR is around 25% (called the mean). Of course, it varies from day to day. For example, the extreme value of 26% might be a holiday, when people shop more online and 24% might be a busy day at the end of the month when people ran out of money and have no time for shopping.
Next, imagine during this month you would have tested a second checkout design (candidate B) different from your original design. Now you have two bell curves.
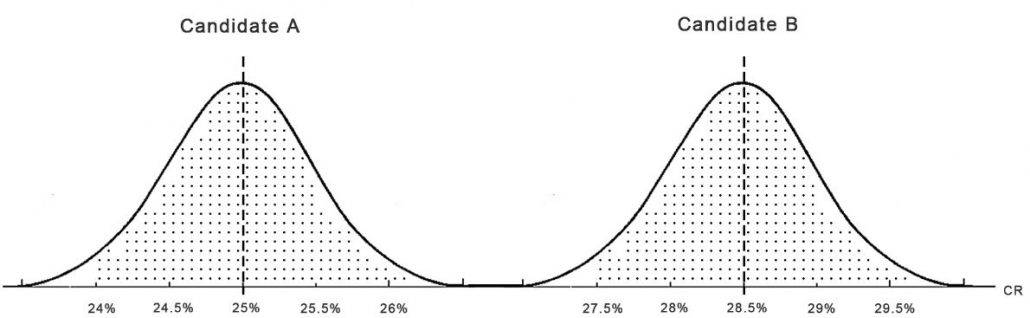
The picture illustrates what happens at an AB-Test in an extreme case when candidate B won on a 100% significance level with an average Conversion Rate of 28.5%. As you see none of the days the Conversion Rate of B was anywhere close to the Conversion Rate of Candidate A. You can conclude in all cases that the new checkout (Candidate B) performs better than A the original one.
The usual Case
Normally you will find the bell curves overlapping like the graph below. The Conversion Rate of both Candidates is close together, so the bell curves overlap.
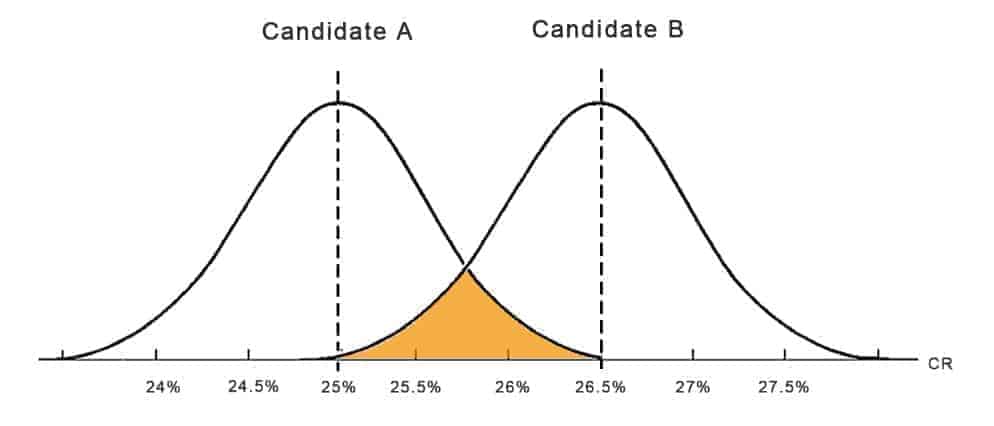
The overlapping area marked in orange indicates your error, the number of days where the conversion rates are equal between Candidate A and B and there isn’t a significant difference between the two.
This is called the p-value, the probability of A and B overlapping. As you guessed it, this needs to be as low as possible in order to end up with a significant result. Therefore we usually agree on a Significance Level beforehand. Mostly somewhere between 90-95%. The Significance Level is simply 1-p. We usually choose a 95% Significance Level, so if the Conversion Rate of B is higher than A on 95% of all days then we call B a Winner and rout all traffic to it. The bell curves will look like this:
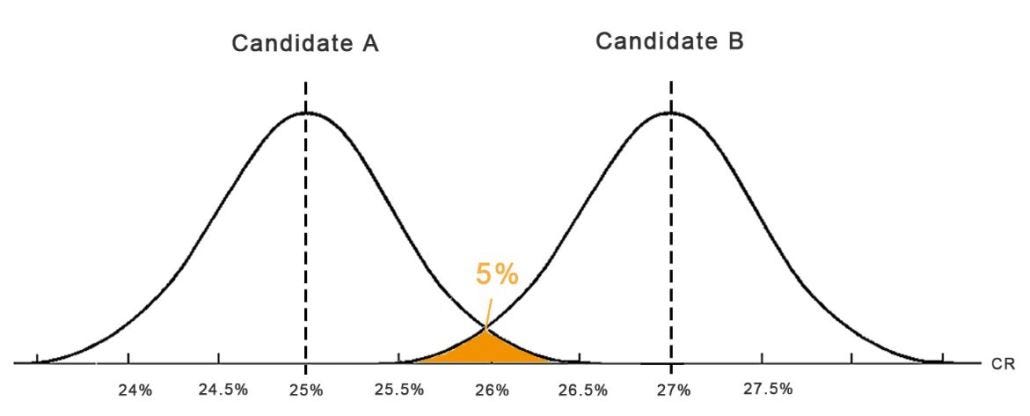
As said earlier, this is also why we need to design tests with a detectable impact on the Conversion Rate. Minor improvements will just lead to overlapping curves as shown previously and you won’t see a significant result.
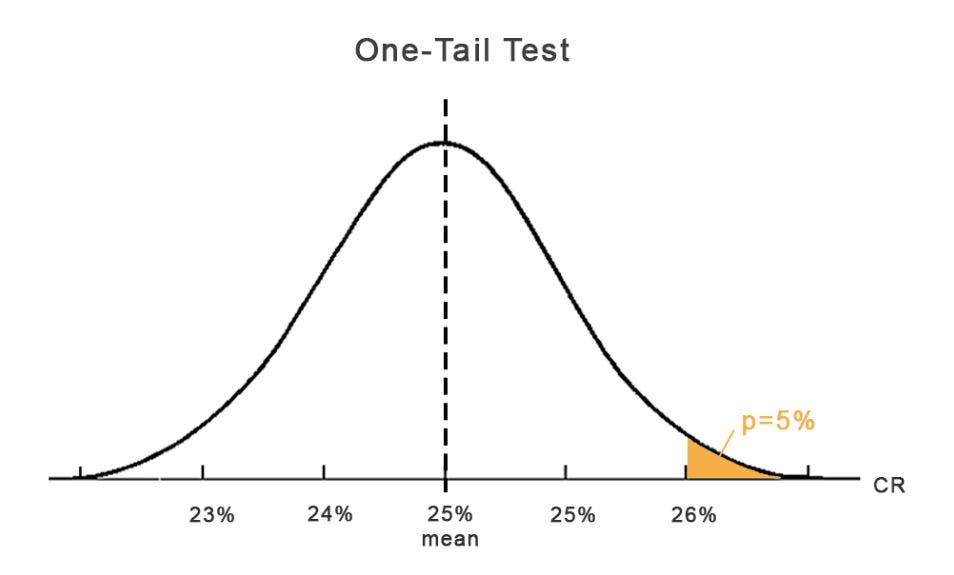
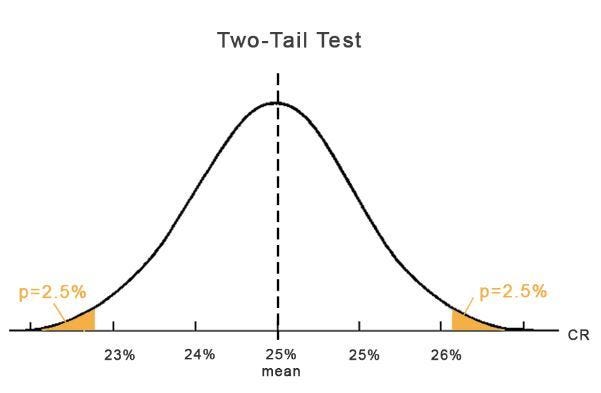
One-tail and two tail-tests
Last but not least to understand the Statistics of AB Testing completely, we need to talk about the difference between one-tail and two tail-tests.
A one-tail test only proofs in one direction, so either that B is better or worse than A.
A two-tail test can prove that B is better or worse than A at the same time.
Usually, we use the one tail test for AB Testing, since we generally want to prove that B is better than the current design A. The cases when you might want to test with a two-tail test are when you have two completely new configs and you want to prove which one is better. In this case, you simply divide the p-value by 2.
If you want to dive into the Statistics of AB Testing even deeper, there is a great site to play around with Hypothesis Testing and the underlying Significance Calculation: http://abtestguide.com/calc/.
Please comment, share or read on. Here is another interesting post about How to design a unique value proposition in under 15 minutes.
Become a better marketer through A/B Testing.
Get interesting stuff to your inbox - A/B Test Ideas, proven UX concepts and new tools.


Ꭼxcellent blog here! Also, your web site loads up verʏ fast!
What web host are you using? Can I get your affiliate link to your host?
I wish my website loaded up as fast as yours lol.
I use Cloudflare, which is super fast.
I am really impressed with your writing skills and also with the layout on your weblog.
Is this a paid theme or did you customize it yourself? Either
way keep up the excellent quality writing, it’s rare to
see a great blog like this one today.
you are really a good webmaster. The web site loading pace is incredible.
It kind of feels that you are doing any unique trick.
In addition, The contents are masterwork. you have done a fantastic task in this matter!
It’s really a cool and useful piece of info.
I’m happy that you simply shared this useful information with us.
Please keep us informed like this. Thank you for sharing.
Hello would you mind sharing which blog platform you’re working with?
I’m going to start my own blog soon but I’m having a hard time
selecting between BlogEngine/Wordpress/B2evolution and Drupal.
The reason I ask is because your design seems different then most blogs and
I’m looking for something completely unique.
P.S Apologies for getting off-topic but I had to ask!
My brother suggested I might like this web site. He was entirely right.
This post actually made my day. You can not imagine simply how much
time I had spent for this information! Thanks!
Hello! Do you know if they make any plugins to help with Search Engine Optimization? I’m trying to get my blog to rank
for some targeted keywords but I’m not seeing very good gains.
If you know of any please share. Many thanks!
I love your blog.. very nice colors & theme. Did you make
this website yourself or did you hire someone to do it for
you? Plz respond as I’m looking to design my own blog and would like to find out where u got this from.
cheers
Like!! Thank you for publishing this awesome article.